
A Code Story Lesson – Application Profiling
I wrote this article to help others and share my tech knowledge solutions using Visual Studio Enterprise 2017 test frameworks.
Application profiling involves the study, measurement, and reporting of code quality performance while the program is executing and users are interacting with the program. Visual Studio can run application profiling on your current loaded project, an external running program, or even ASP.NET web applications. My previous articles mentioned mainly the static code quality metrics concentrating on the source code, but profiling is less about the source code but more about how it consumes resources (static versus dynamic). Profiling captures statistics on how well a selected program interacts with the operating system and the .Net framework allowing the developer to troubleshoot various conditions.
Let’s dive in and get started with a Story.
 Madame Future Seer decided to make a simple Fortune Teller program [link Visual Studio Solution]. In a rush to deliver and showcase her product for release, she did not take time to perform application profiling on her code for problems. It compiled without errors, right? She manually tested all different user input scenarios (great job!) so why should she care about running Application Profiling on her project?
Let’s see and take a look at what could be problems…
She loads her project into Visual Studio Enterprise 2017 and runs a performance session.
Running a Performance Session
Profiling is performed during performance sessions. To start performance session, select Menu > Analyze > Performance Profiler.
The Performance Profile window will show with the default option of “Performance Wizard” selected, which will gather data on one of selectable categories (on the next screen).
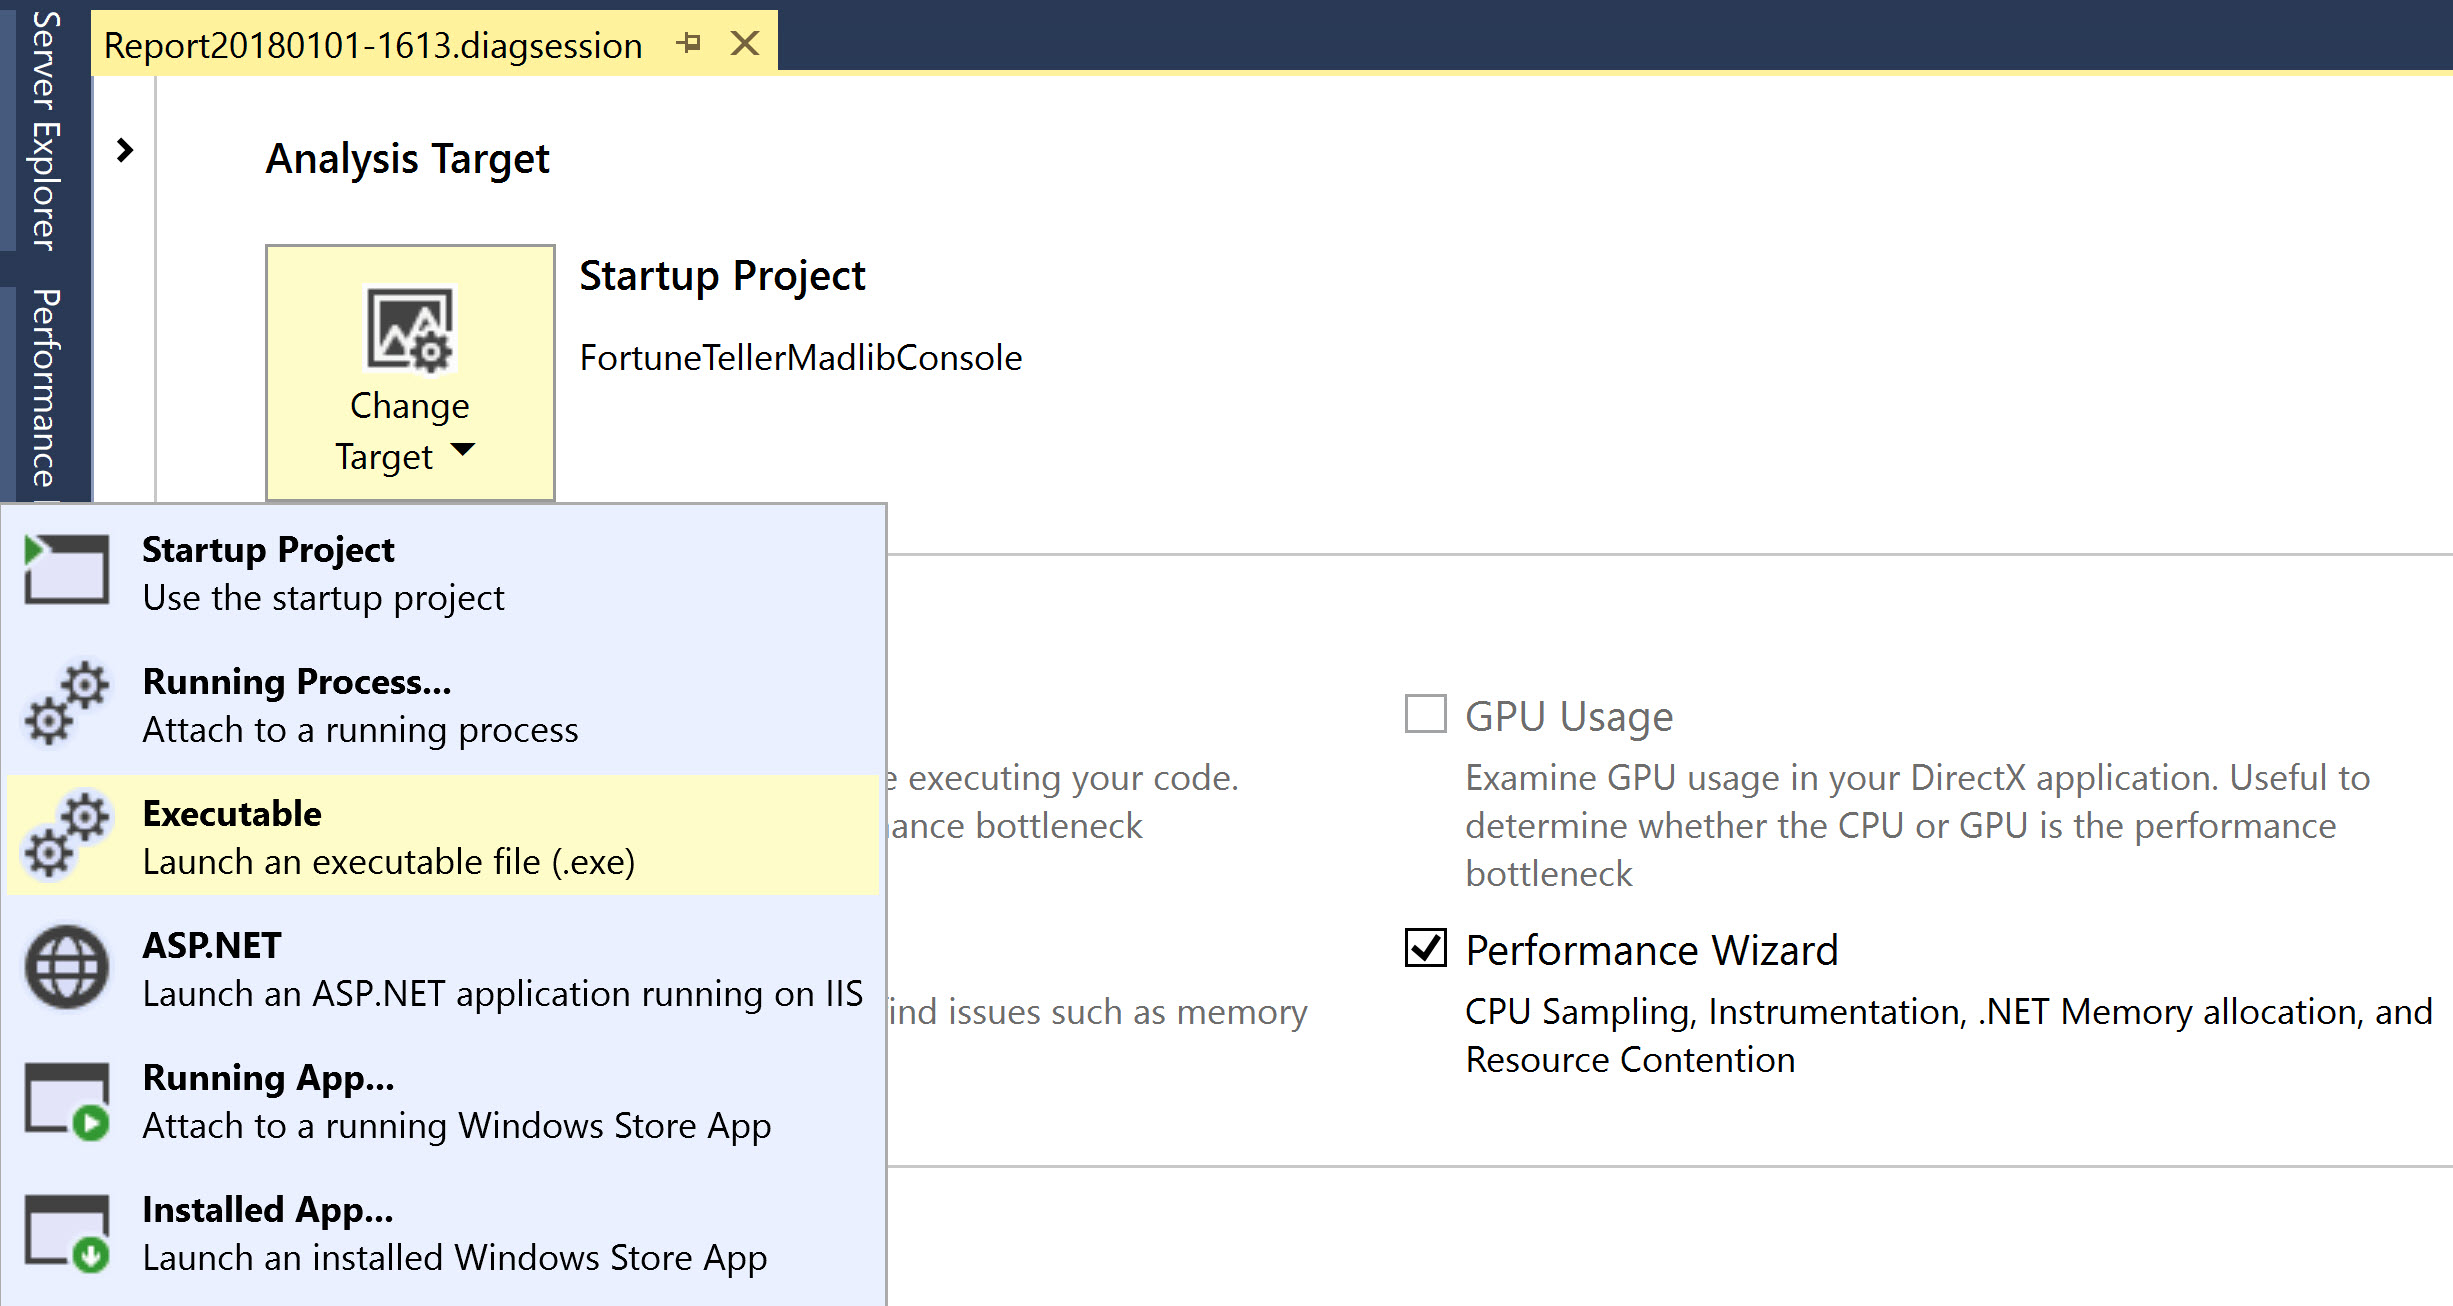
Analysis Target
By default, the “Analysis Target” will be the Startup Project of the Visual Studio solution that you have previously loaded. Madame Future Seer’s case example has one project for her Fortune Teller program. Madame could had started her Fortune Teller program running in the background and then selected “Running Process…” to find and select her running program for study. She could also perform the study by configuring Visual Studio to directly launch her Fortune Teller program executable file. If she had made her fortune into a web application (which she does in upcoming article) she could test it out via the ASP.NET option but that is only testing apps on the local IIS.
If we could do application profiling from Visual Studio on apps running in the cloud on Azure that would be GREAT!

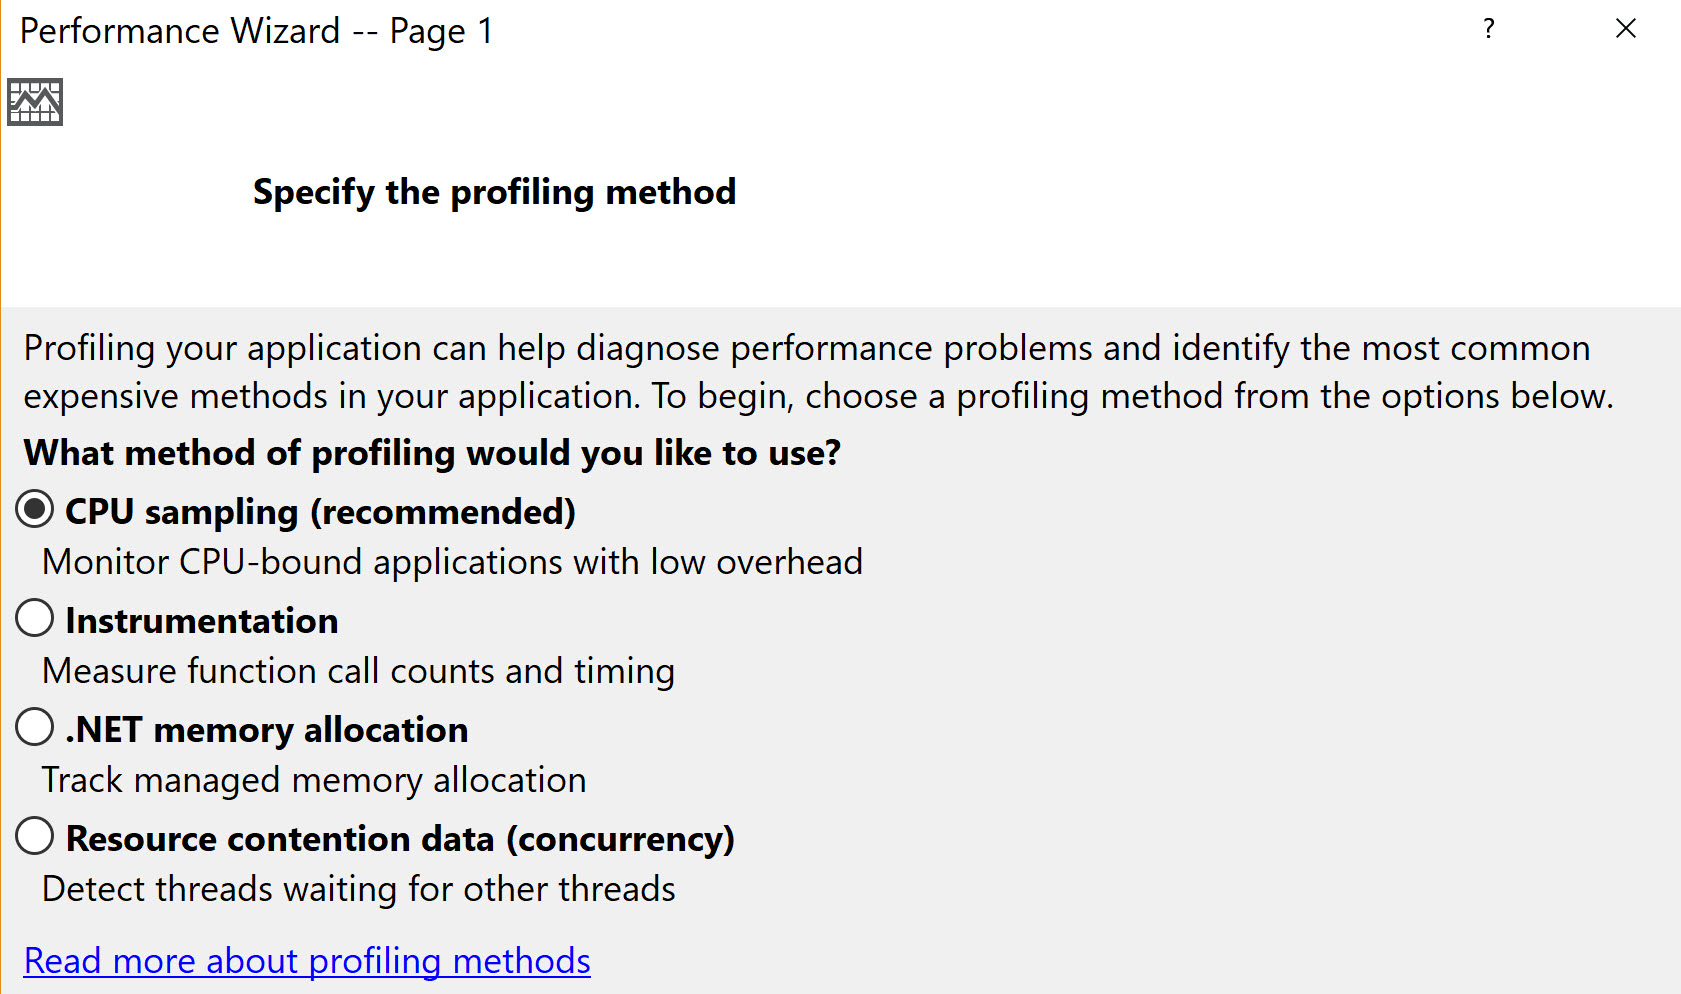
Specifying the Profiling Method
Madame Seer clicks “Next” to continue to performance wizard where she now has to select a profiling method (see below).
A little bit perplexed and confused, Madame asks her crystal ball (the artificial intelligence entity) for help and it gives her another lesson in code quality and performance monitoring options available through Visual Studio.
CPU Sampling: Choosing the run CPU Sampling during the performance session collects statistical data about the work performed and can help you troubleshoot CPU spikes.
Instrumentation: The Instrumentation option collects timing details about each function call and can help you troubleshoot IO bottlenecks.
Concurrency: Detecting race conditions is very important in multi-threaded applications and running the concurrency performance monitoring will help detect these problems.
.NET Memory: Lastly .NET memory allocation and garbage collection are sensitive areas ripe with potential memory leaks. Yes, you can get memory leaks in .NET applications. I got one myself once with using a Timer Tick object that would not die properly. Probably the most important performance monitoring session you can do is with .NET Memory. Let your application run awhile, tinker as a user, then monitor to see any patterns of increasing memory or significant time delays in the garbage collector freeing up the resources.
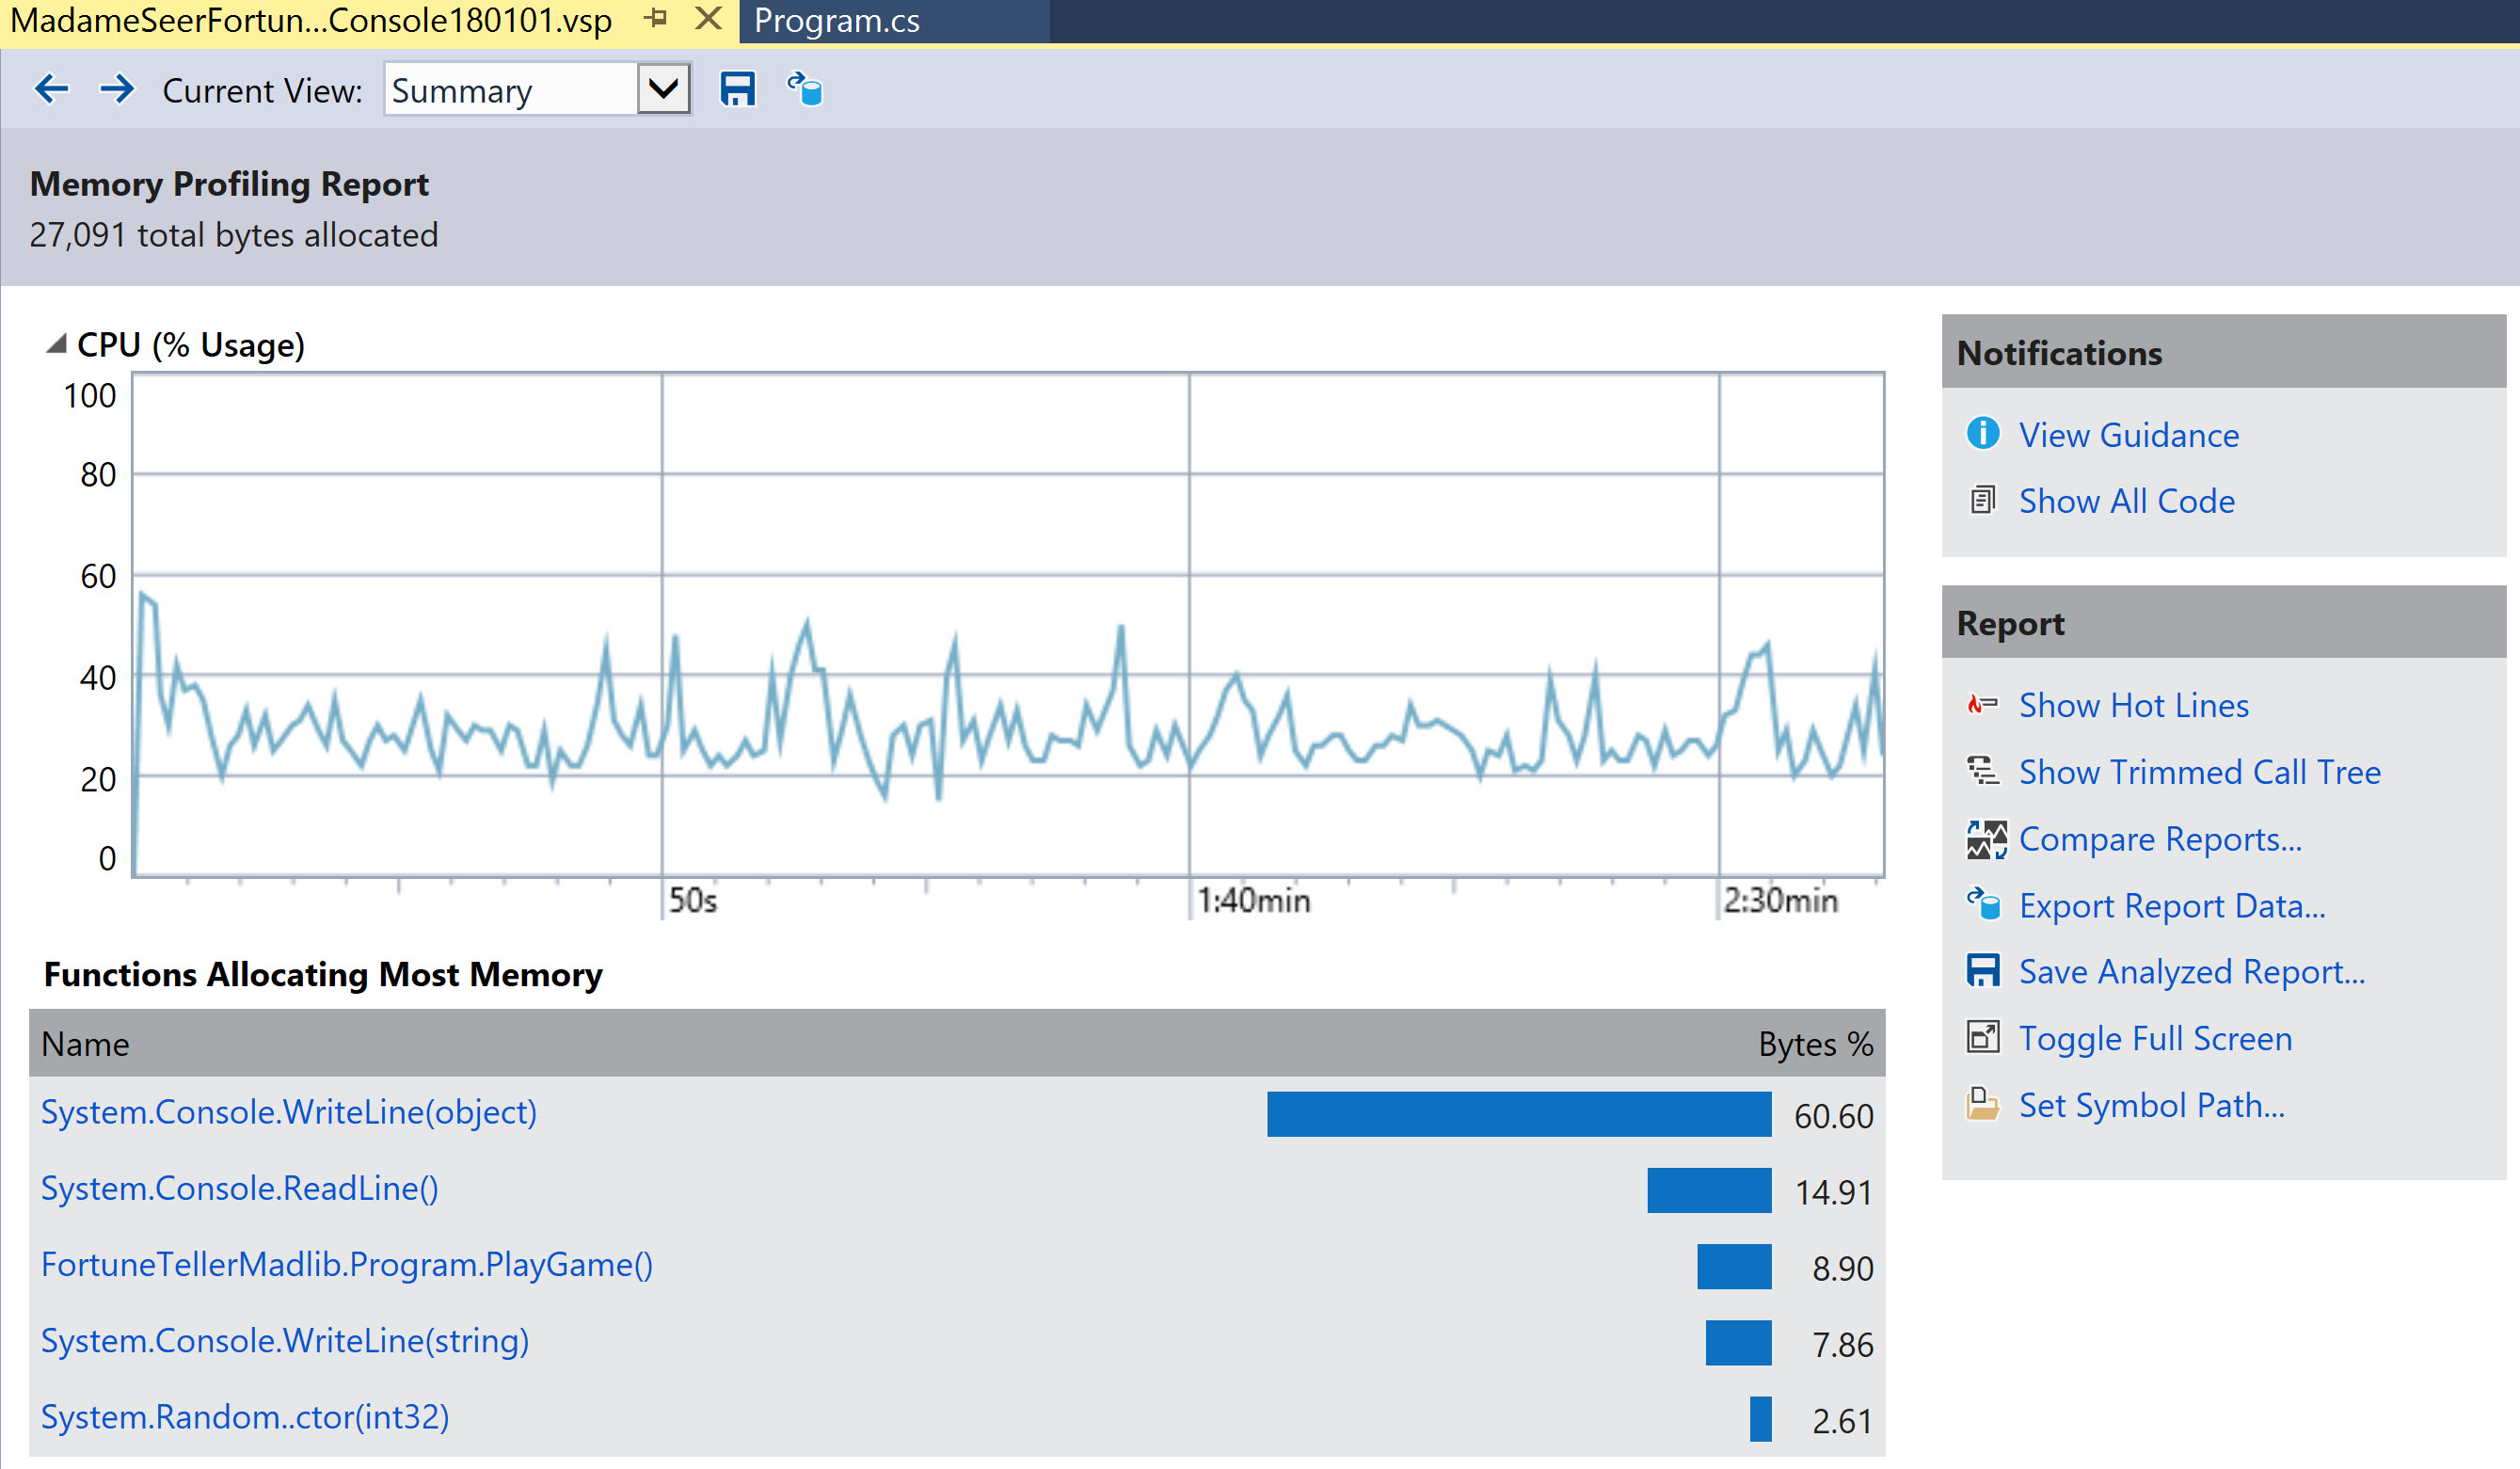
Madame Seer was delighted to explore all the performance profiling options to test her Fortune Teller program. She ran her program with Memory profiling and did not notice any significant changes in memory, leaks, etc. “Great Job!”, said her crystal ball. “Thanks”, Madame smiled.
Our story is not over yet. After the New Year, Madame Seer had a brilliant idea to upgrade her Fortune Teller program to version 2.0 [link bad Visual Studio Solution] and deliver a special Valentine’s Day love forecast to her fans.
This time around, Madame Seer put her crystal ball (the artificial intelligence entity) to work running the program, application profiling, and other testing until the ball turned sick and sour faced.

“Help me”, said the crystal ball, “I think my memory banks overfilled very fast”. With worrisome concern Madame Seer then triggered the emergency shut off and reset of her crystal ball entity.
Madame Seer decided to manually test her application with Visual Studio’s performance monitoring and noticed her .Net memory allocation was unusually high after a few minutes of using her program.
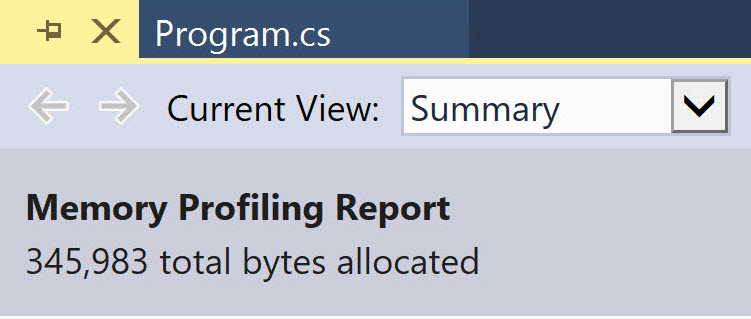
She used the Memory Profiling Report to troubleshoot the root cause of the issue, code blocks, and realize her mistake.
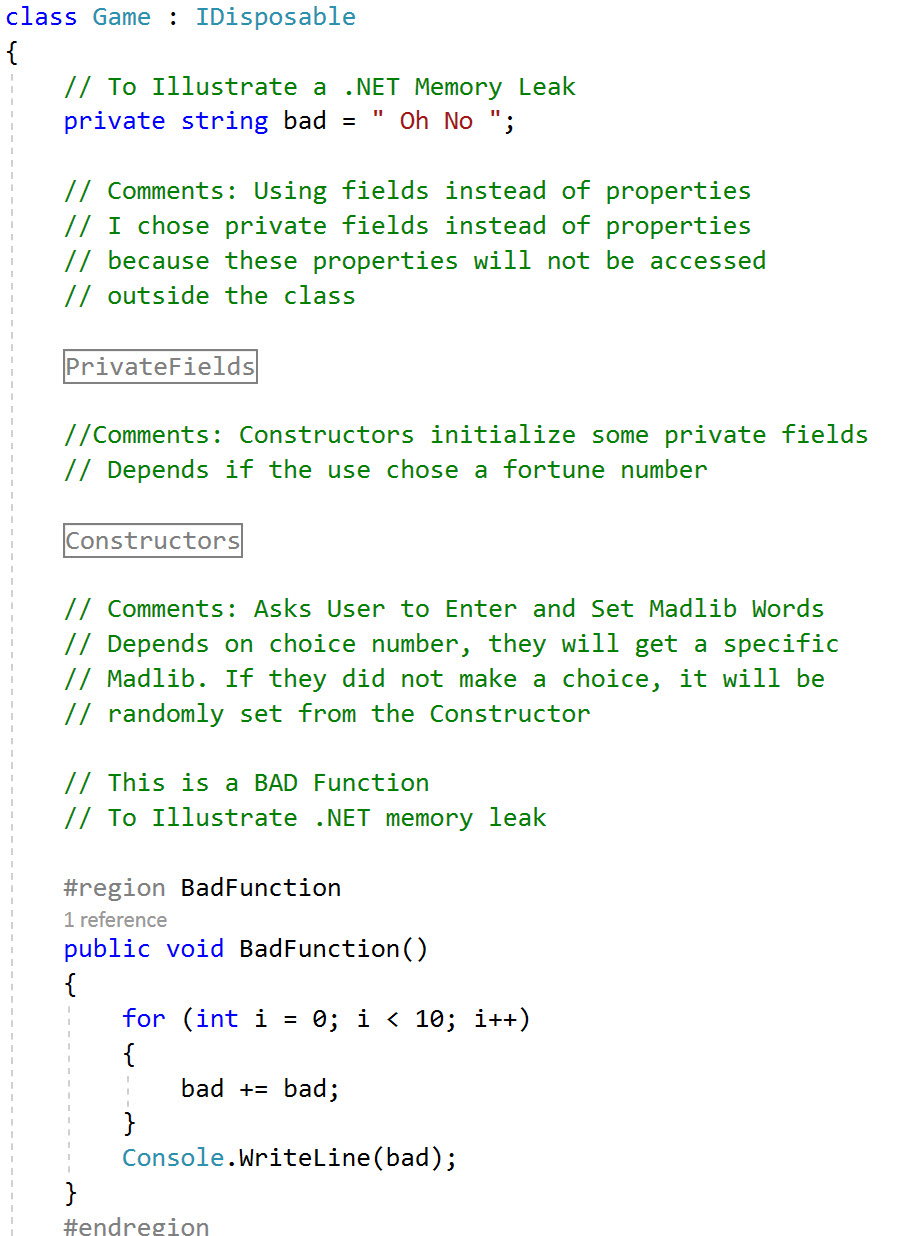
Instead of using a StringBuilder object to store her messages, she made a mistake by creating and using a never ending list of string type objects. She erroneously had thought her code would be using only one string over and over. For example, if you declare a string called stringHello = “Hello World” and add or modify it, it actually creates another string in memory and can get stuck there a very long time if it is still in scope like Madame’s new code. When you get a lot of unwanted items stuck in scope and memory where the garabge collector cannot remove or periodically clean up fast enough, you’ve got a memory problem like Madame’s new program!
Summary
 Our story had a happy ending. Madame Seer was able to See her mistakes where her crystal ball, the AI (artificial intelligence), could not detect until it was too late. She corrected her code to use a String Builder object to deliver her love fortune message and became a little more cognizant of her .Net memory usage in her future program development. Her crystal ball (AI entity) made a full recovery and learned by the experience to watch out for fast propagating .Net memory leaks in Madame’s programs. Now, when it helps her test, they both closely monitor the memory resources and it hasn’t had any more “sour” faces!