
GENCO Investment Strategies by Simulation
for Demand-Side Role for Investments and Capacity Adequacy
This project will present an applied and game-like approach to simulating the load growth, investment decisions by two types of generation technologies, demand-price responsiveness, and reliability, of a test-case power system. The simulation begins as a 9-bus system with existing generation (3 generators) and transmission lines (8 lines). System topology can be viewed in a figure throughout the game with the annual generation and load at each bus. In addition, dynamic color-coding is used to highlight transmission lines that exceed MVA ratings and highlight bus voltages that violate any limits. The winning objective of the player company (you) is to maximize his profit. Reliability can be tracked by viewing the N-1 generator and line contingencies every year, but this does not influence profits. There are two generation technologies used: coal and gas turbine. Each technology will have a similar competitor in the simulation. The competitor can bring down the market price and reduce the player’s profits significantly. The clock starts at T=0 in the investment game with a historical record of past prices and projected prices based on a lack of investment. As time moves forward in yearly increments, the load, prices, investment costs, and other variables are adjusted to that of the player’s performance. The player has the opportunity to study various profitable and unprofitable investment alternatives each year of the simulation. If he invests at the right location, and in the right planning year, his company can make windfall profits. Competitors randomly participate in adding extra generation in random areas of the system based on the competition level settings. The challenge for the user is to study the effects of his investment decisions on market prices, reliability, and his profitability.
Background
The demand for cost efficiency, which has caused an upsurge of deregulation and liberalization initiatives in the power industry, will play a key role in current and future market designs. The objective behind power system deregulation is to increase the competition and with that the economic efficiency in the building and operation of the electrical power system. Liberalized markets focus on profit maximization in lieu of cost minimization as under regulation. Uncertainty in the power market spot prices and decentralized decisions bare more risk on the investors than under the traditional regulation where utilities were allowed to recover their risk under rates. A common challenge amongst market designers and policymakers is how to keep a competitive energy market that can ensure sufficient generation supply to meet the demand and ensure reliability.
The focus of this paper and project is based on an energy-only market. Under this market, there is no capacity guarantee put in place to ensure sufficient generation supply. Energy prices fluctuate and when they are high enough, justify new investments. There are many energy-only electricity markets around the world, including the original California market, Nordpool, and the Australian Victoria pool. A shortage of capacity will have the effect of increased prices and increased investment; excess capacity will drive the market prices down to marginal costs. The price volatility in an energy-only market has high political involvement and has challenged both politicians and regulators. With this market, there is no central resource planning in place to protect resource shortages and make reserves available. Investors will respond only to short-term or spot market price signals. Little investment will take place in low price years causing shortages to develop like what happened in California in the late 1990s. New capacity takes time to build and when there is a lack of planning and coordination, there is generally overbuilding which can lead to very low market prices and deter new investments thus starting the cycle over again. A more price-responsive demand may help moderate these cycles. The energy-only market model will ultimately fail to ensure system reliability and may cause market power concerns.
Overview of Project
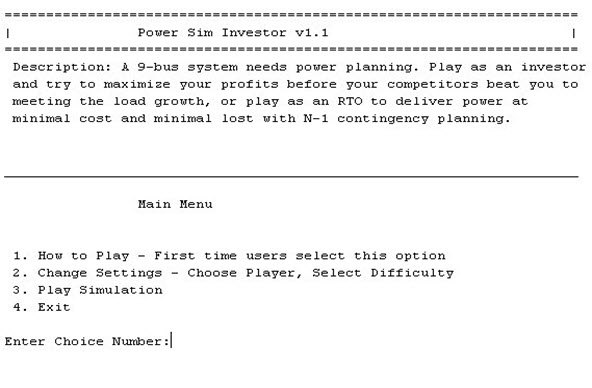
Power Sim Investor Main Menu
Power system reliability, at the transmission level, combined with unit commitment optimal power flow, has been common topics in many of my graduate courses. However, economics and present value analysis studied in this course has opened a new perspective into the past, present, and future infrastructure of the electric grid. My project goal was to combine these three perspectives and to see the effects that individual investors may have on prices, scarcity, reliability, and demand-response. I spent several weeks developing a sophisticated C-based program in MATLAB to simulate investments, competition, load growth, price response, optimal investment strategies, reliability, and profit analysis all based on user direction. The user of course, is you, or anyone who so desires to execute the program. Based on initial settings, many of which can be changed by a simple submenu, the program progresses through a certain period of planning years. During the simulation, the user is given load and price forecasts along with a detailed analysis of investment alternatives. Reliability can be tracked via the contingency analysis option. There will be two main decisions the player (user) can make every year through each time period: invest in new generation, or do not invest in new generation. Competitors, which can be customized in the settings submenu, may invest in new generation decreasing the price forecasts and your profits. The objective for the company players is to, of course, maximize profits. However, if an investment decision is precarious, the player risks losing millions of dollars.
The paper will discuss the simulation process and program functions in detail. High-level flow charts along with pseudocode and tables will explain the program components. An example simulation will then be presented to illustrate the simulation process. A few different scenarios based on customized settings in the submenus will be presented along with summaries. Applicable uses, enhancements, and other possible program functions will be discussed. Lastly, some concluding remarks will summarize the project work. Appendices contain all application code.
Simulation Process
Requirements
To run the Power Sim Investment program correctly the following are required:
• MATLAB Student Version v13 or greater (developed on v14)
• Optimization Toolbox
• Matpower
• Computer running at least 512 MB RAM (1 GB recommended)
To install the program, create a directory in your MATLAB workspace directory called “PowerSimInvestor”. Copy and paste the project files to this directory. Open the MATLAB program and set a path to the “PowerSimInvestor” folder.
On the command prompt type “mainmenu”
>>mainmenu
If MATLAB fails to recognize this command, you need to review installation and documentation for further assistance.
Time Planning
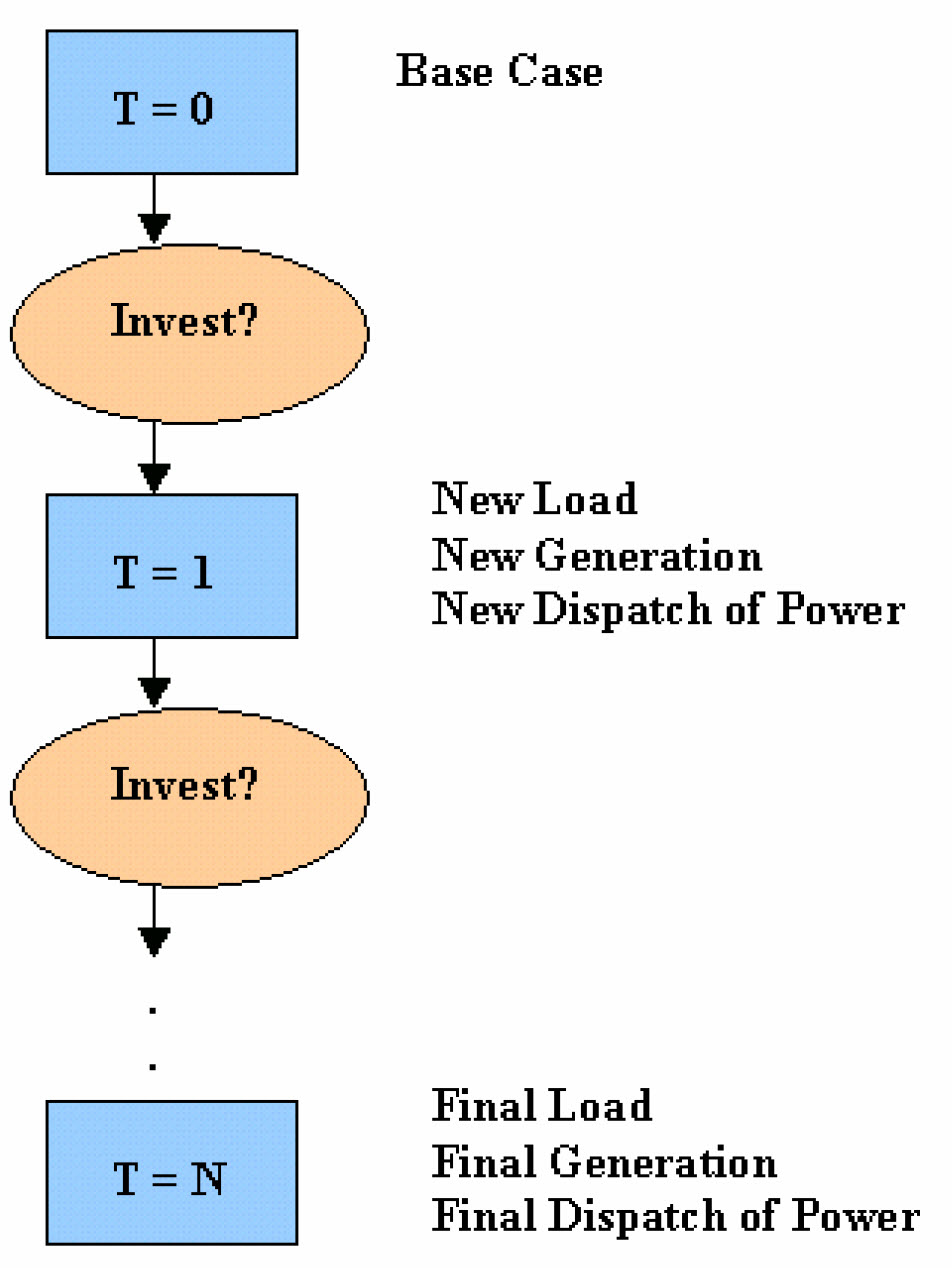
Time in the simulation is based on the number of planning years. For example, if the user decides to plan for 5 years, the program will allow five decision years. For each decision year, optimal power flow is executed and prices determined. Each planning year gives the user two options: invest or continue to the next planning year (do not invest). If the user decides to invest, a generator unit will be added to the system and analyzed like any other generator in the system with respect to least cost optimal dispatch. The investment will take effect at the start of the next planning period. The investor will then be able to see the effective dispatch and annual profits of the generator. A least cost optimal power flow will be in effect for one planning period. Furthermore, the user should also notice that the load in the system increases during the next planning period. Figure 1 highlights an overview of the time decisions from start to the end of the planning period (N).
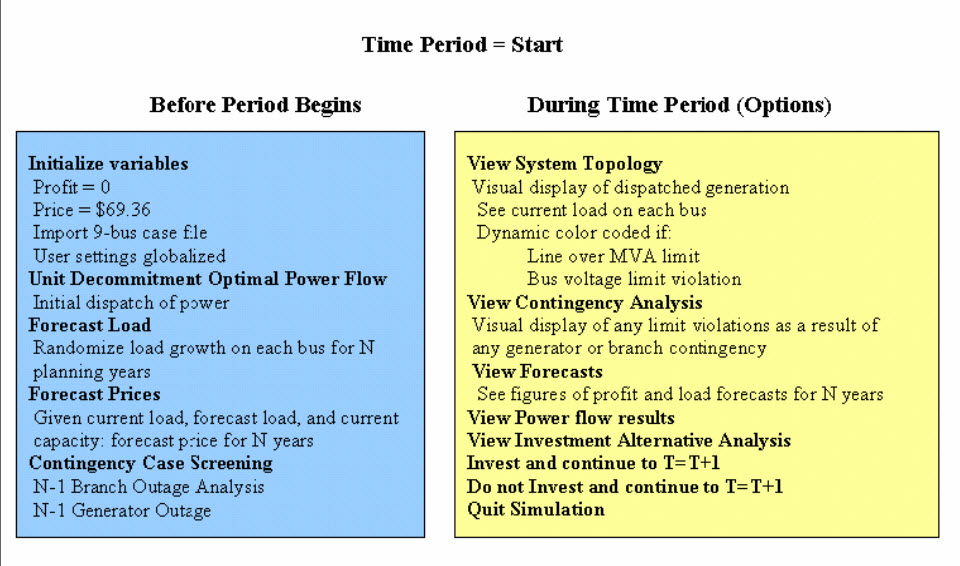
The first period starts at t=0 in the year 2006 of the planning period and will plan for the 2006 year. Figure 2 illustrates a high-level organization of what happens before the user is given a menu of options (before the period begins) and what options are available (during the time period). In order to advance to the next planning year (2007), the user must either invest or choose to not to invest in new generation.
Time Planning Algorithm Start
During the next period, the current market price will be the forecast price for this period from the previous period. The new generation will be added to the model if the user invested in the last period or if a competitor invested. The forecasted load at each bus for this time period from the previous period will be added to the system model. Another unit decommitment optimal power flow will determine which generators in the system are committed and at how much generation. Additional forecasts in load and prices will occur but for N-1 periods where N is the number of planning years remaining. Contingency analysis will use the current system model and dispatch as the basis to gauge security. Profits for each of the generator will be determined for the current planning year based on the current price and the current year’s least cost optimal dispatch. The user will have the same options as the last period and will be able to proceed to the next time simulation.
Player Settings
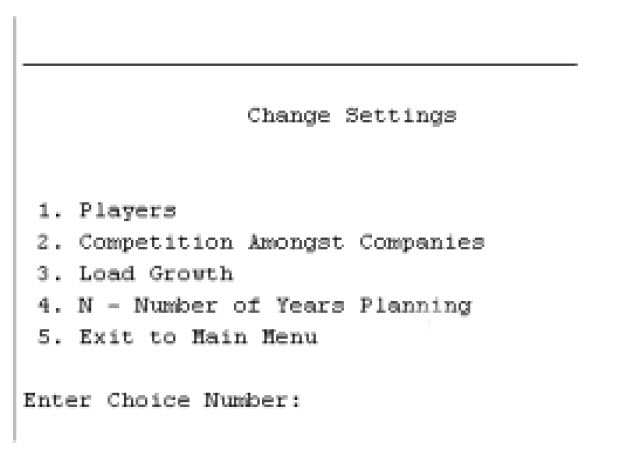
Player Settings Change MenuThe game officially has two types of players: a coal company investor (default) and a gas company investor. The player settings can only be changed at the beginning of the simulation at the “Change Settings” submenu. The player variable only has affect on the cost of the investment and cost to run the plant if it is dispatched. Table 1 below summarizes the generation unit types for a five-year planning period.
Demo
Pictures of the Screen Play
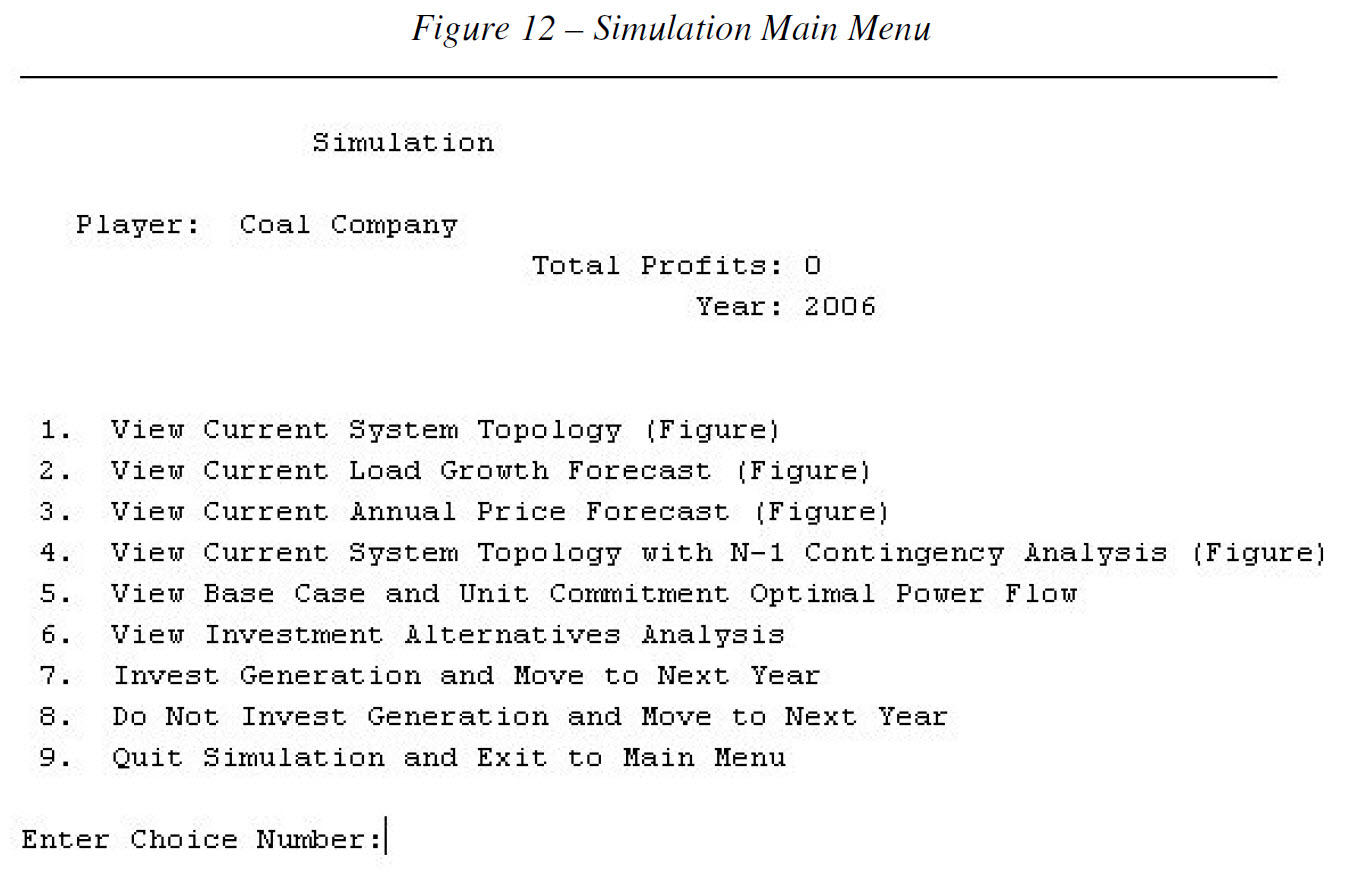
Simulation Main Menu
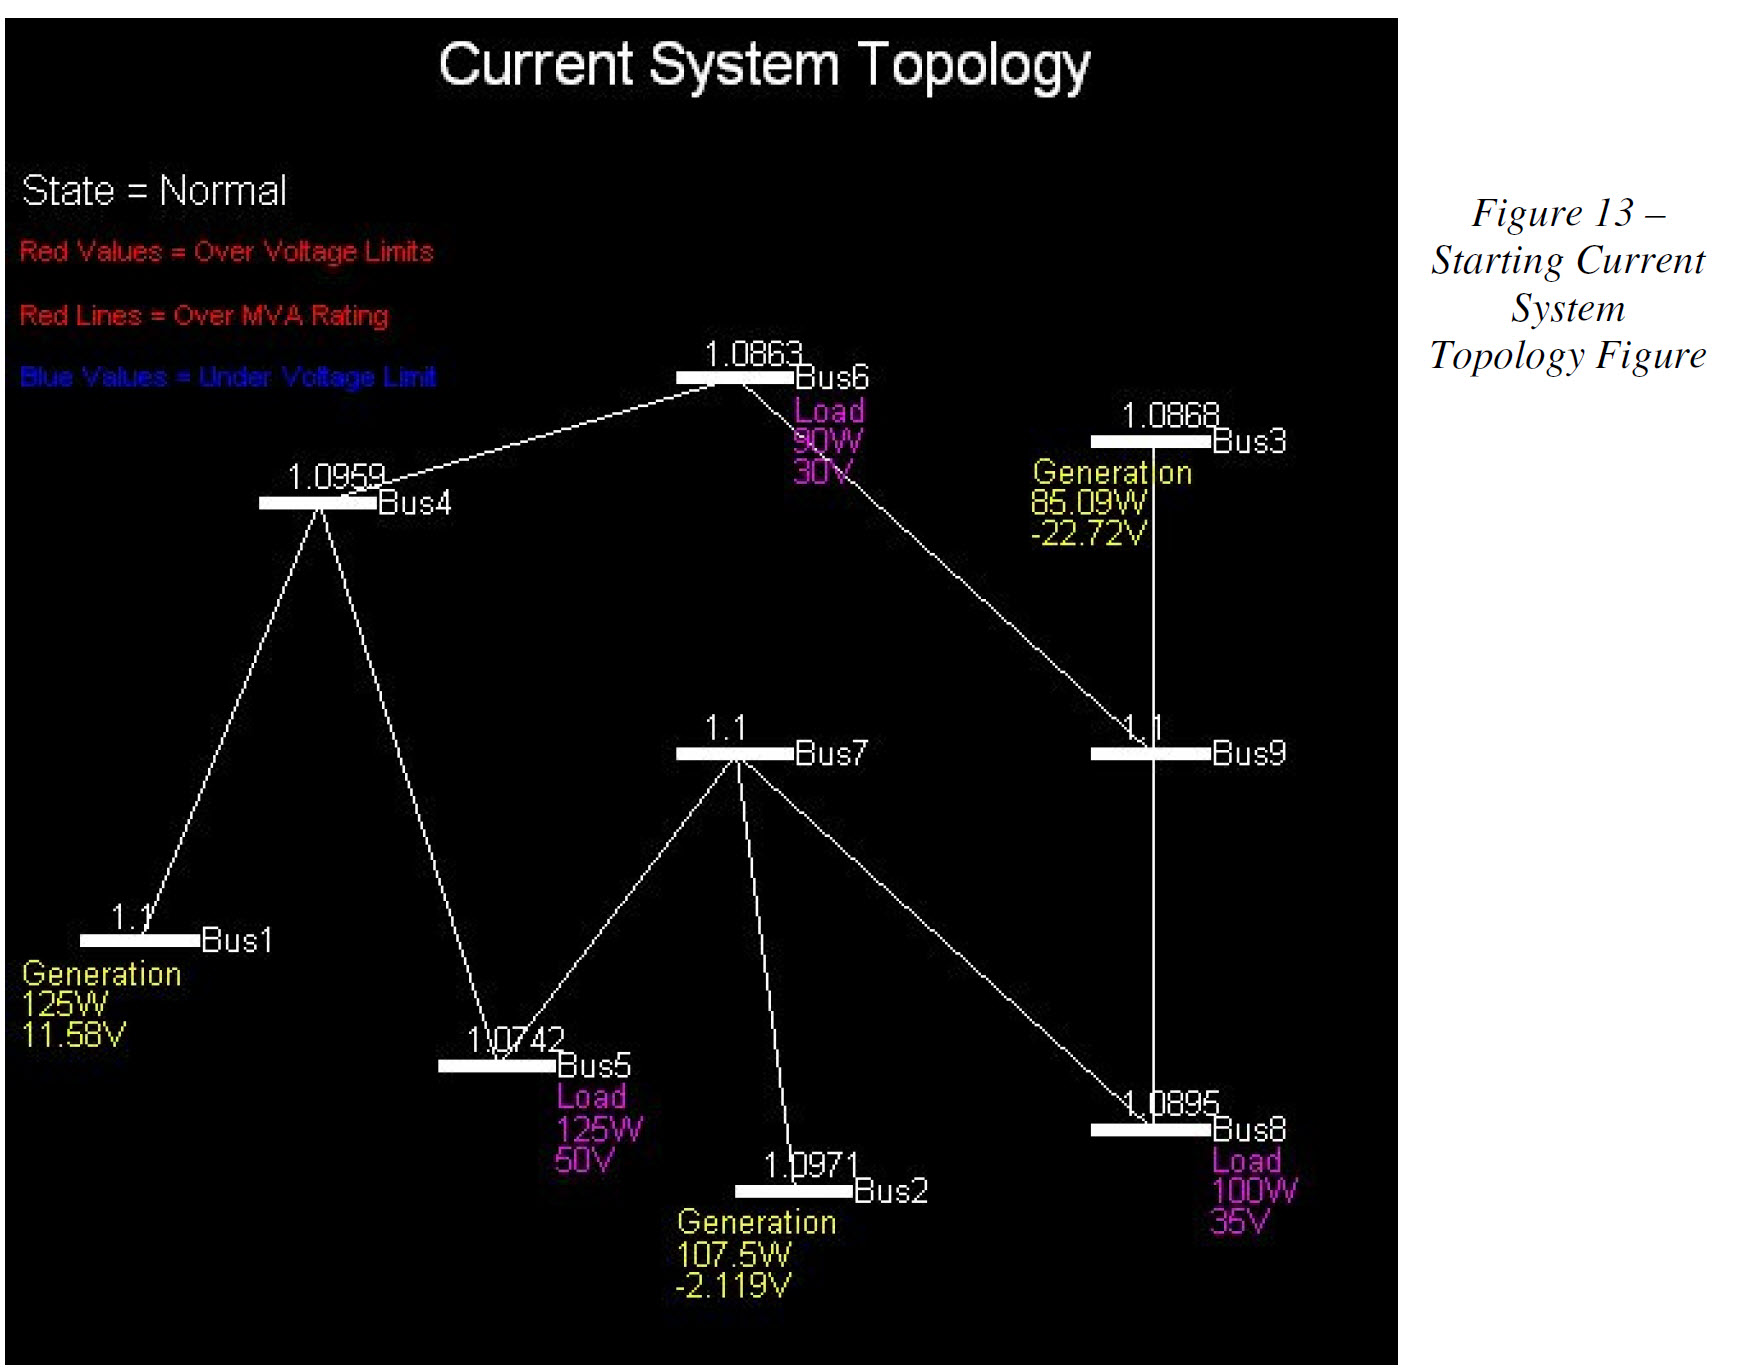
System Topology Drawn with Voltage and Power Flow Data
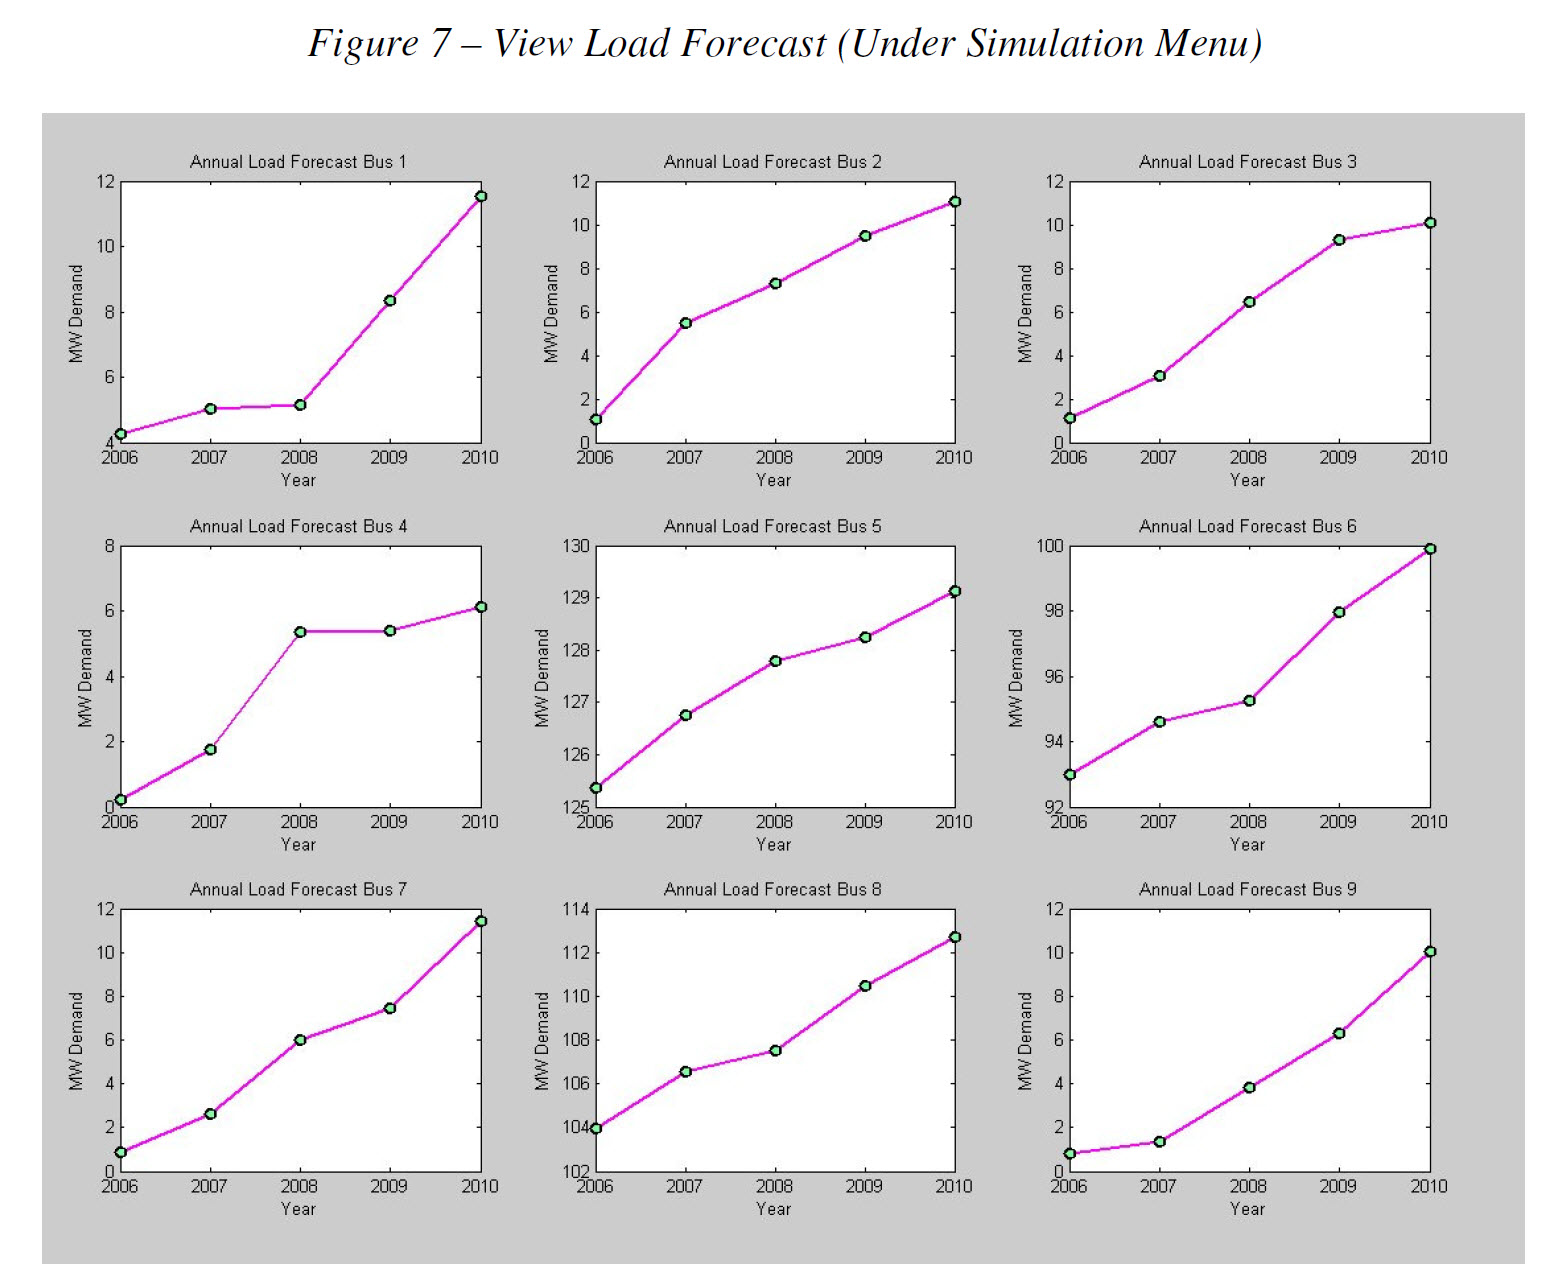
View of Load Forecast Graphs for Each Bus
Algorithms
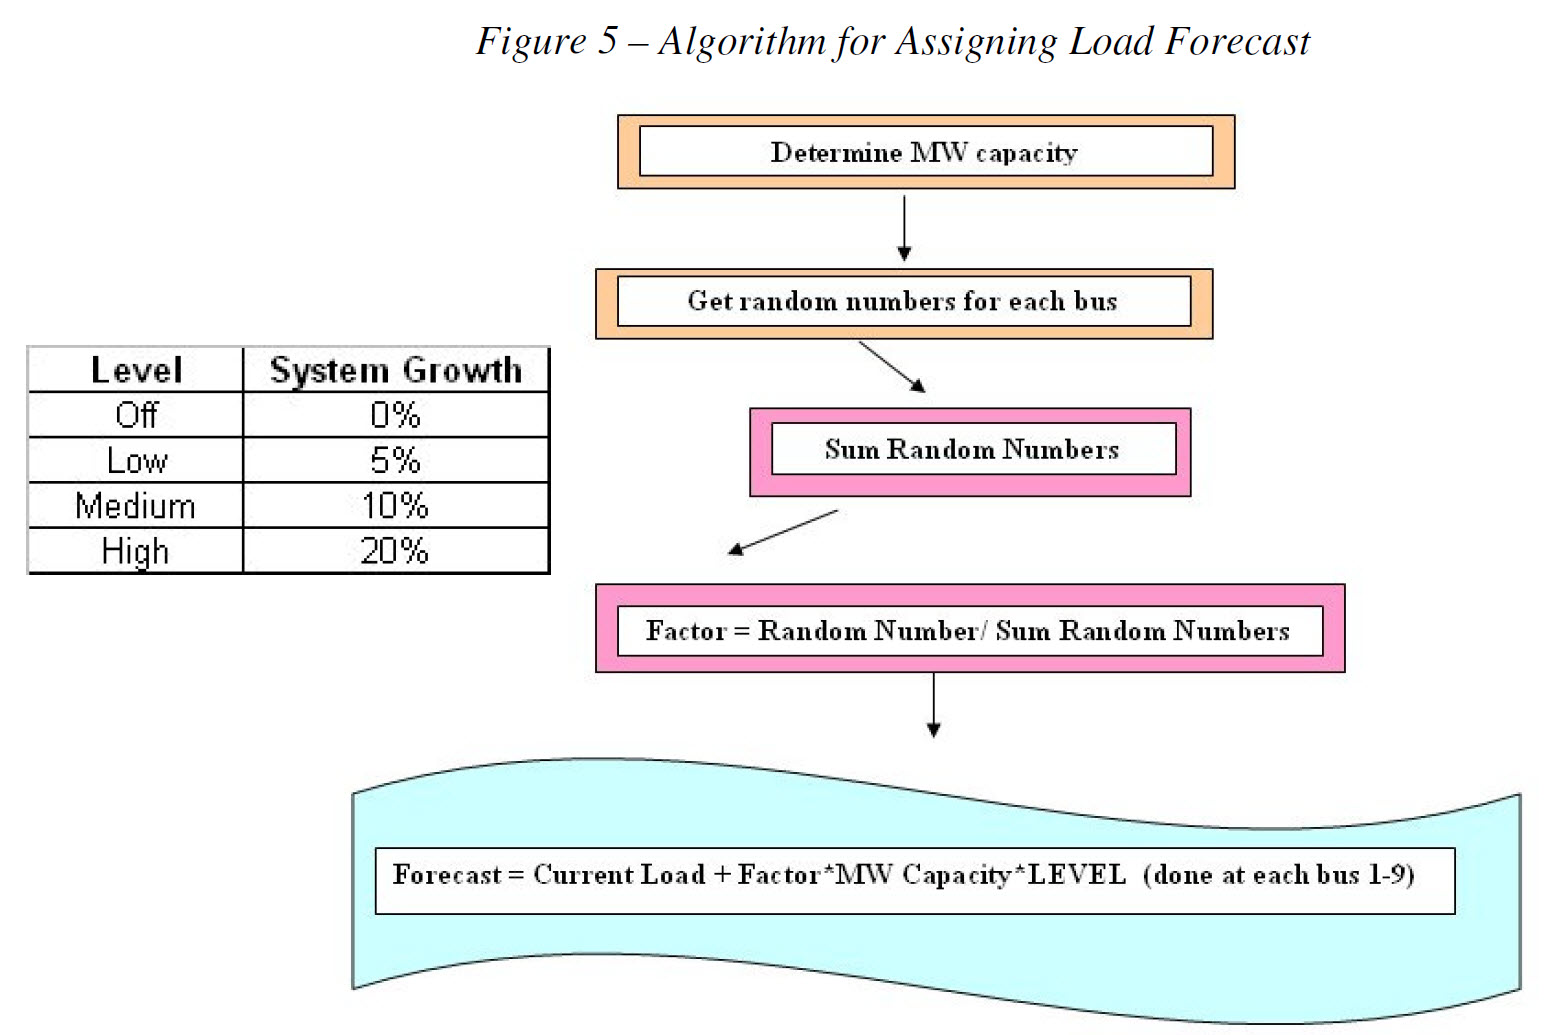
Algorithm for Assigning Load Forecast
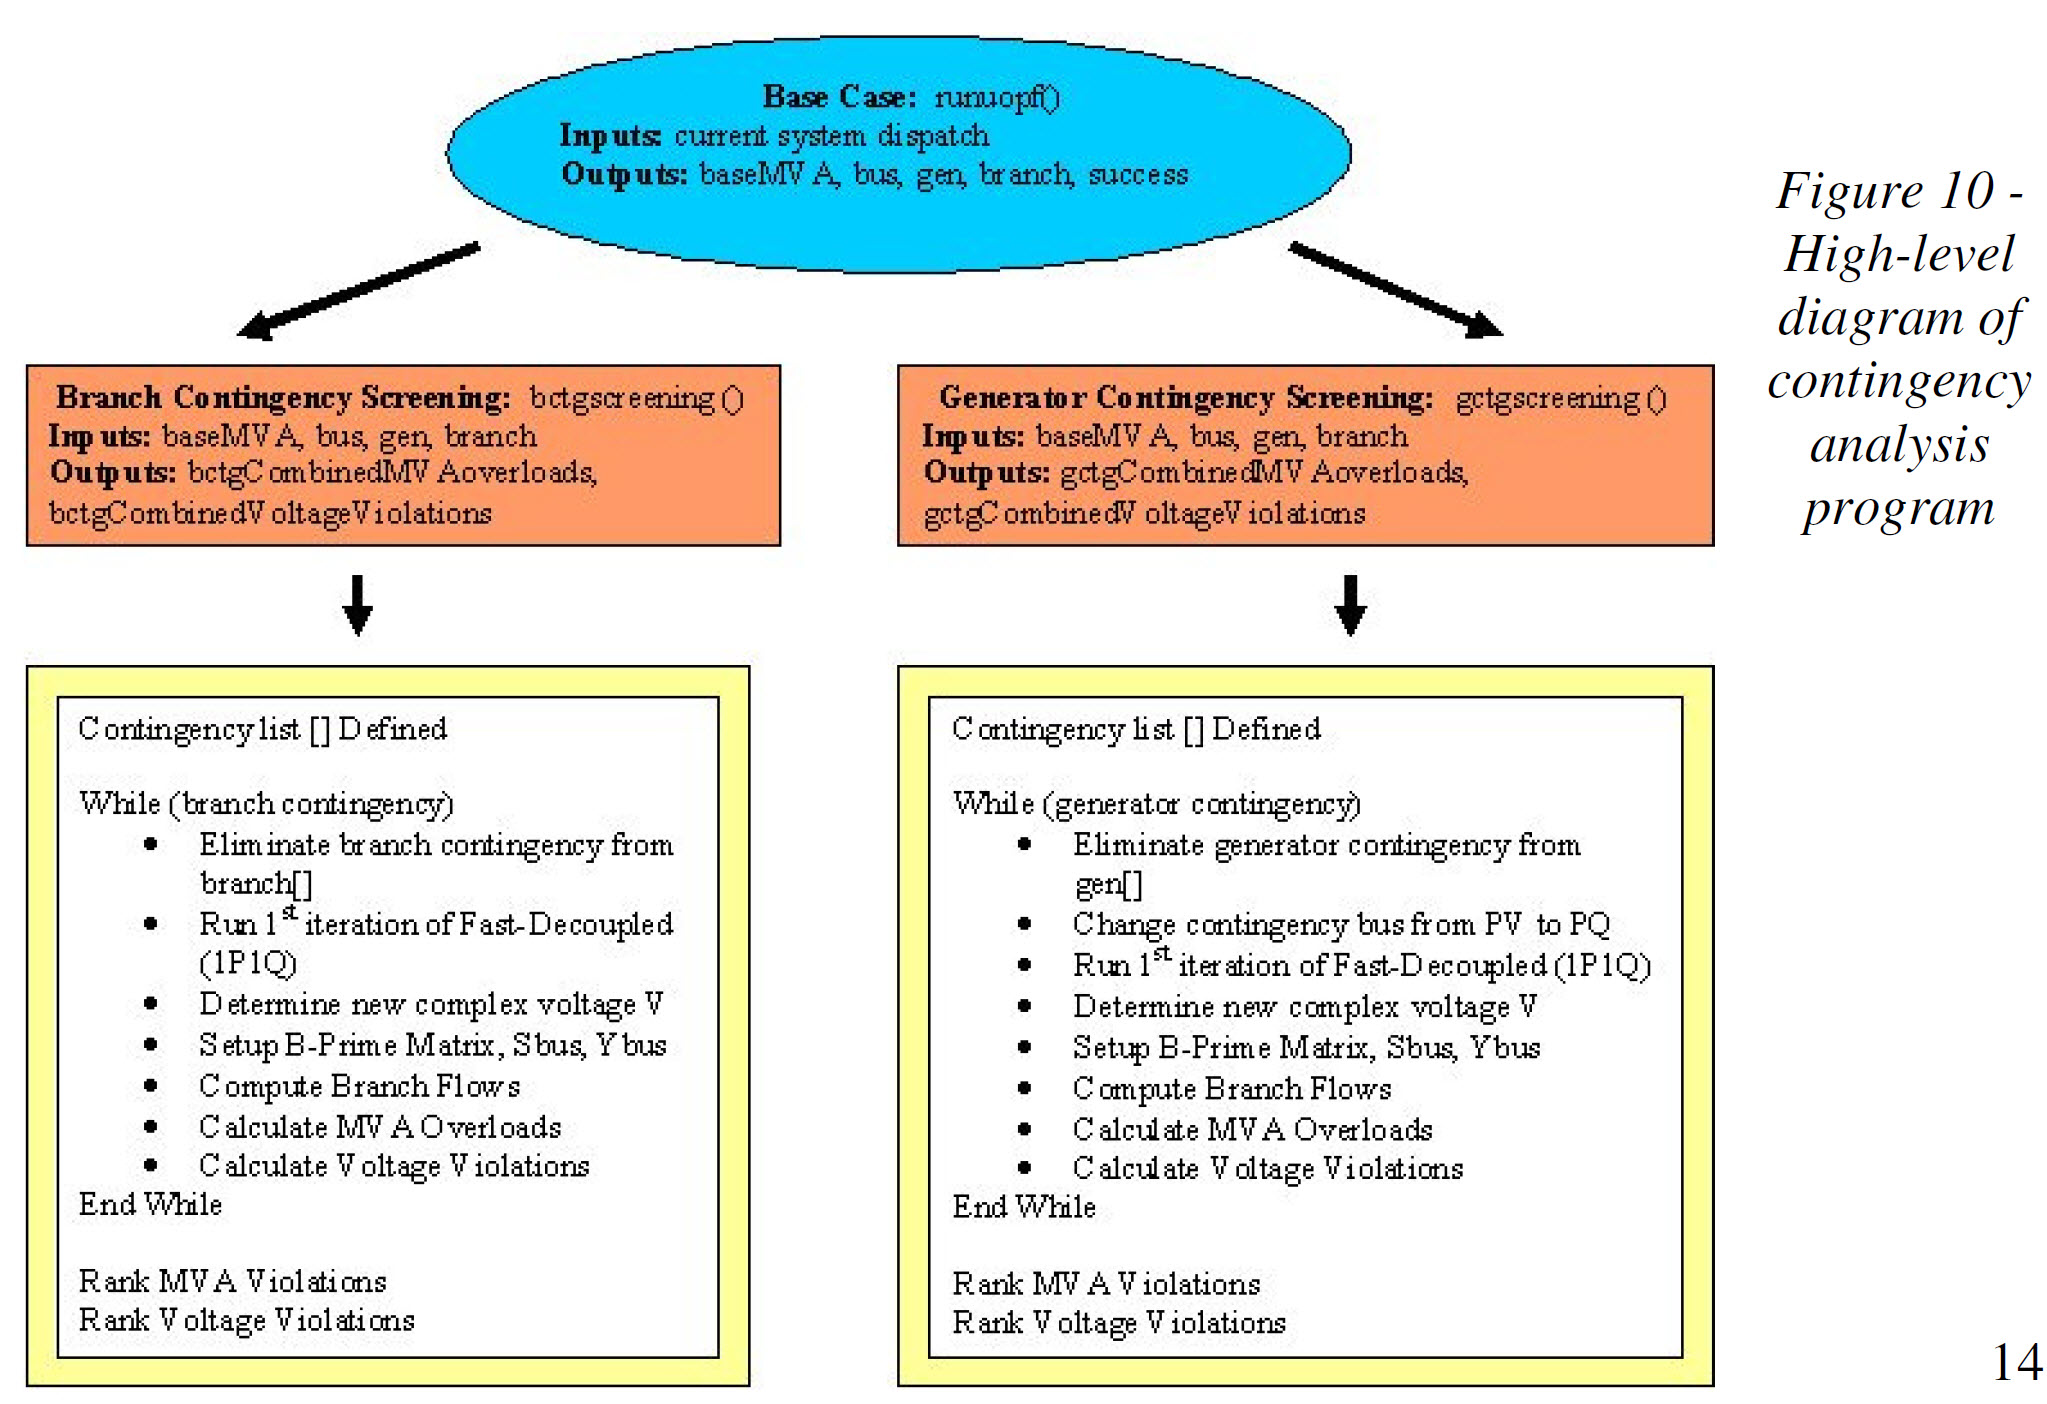
Contingency Analysis Program
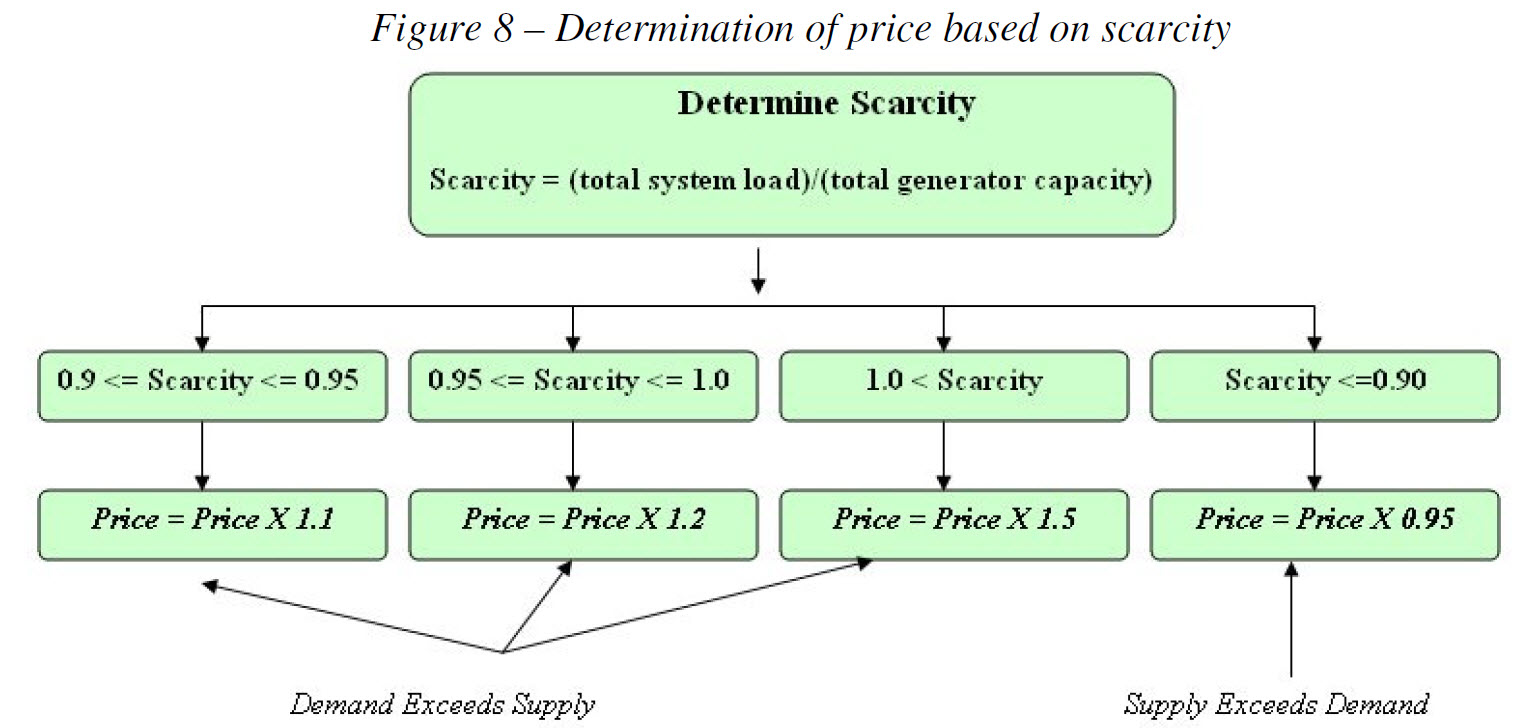
Determination of price based on scarcity
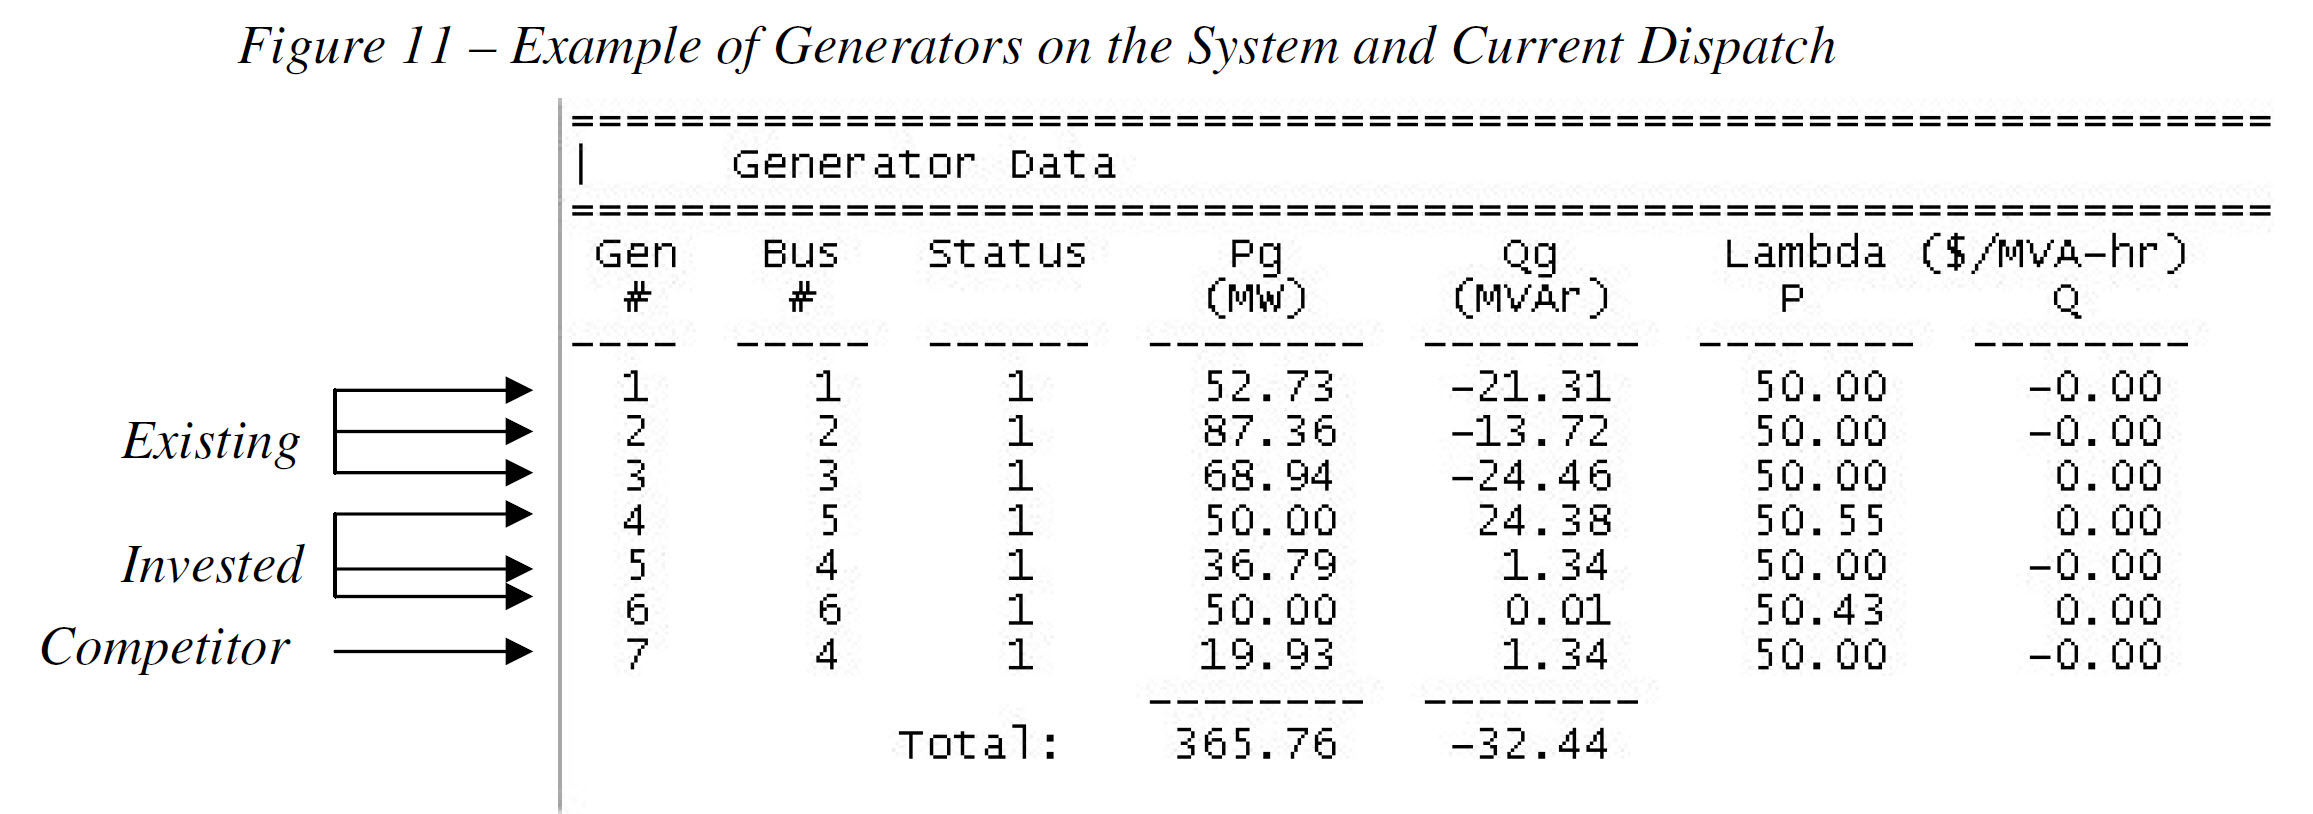
Generator and System Dispatch Solution
My Solution Code
You can view and download the GitHub repository here.
You can also download a zip archive of the project code here.
My Reports
You can view and download the full report with an explanation of the project, algorithms, and strategy here.
You can also view and download a short power point presentation here.